Setup your account
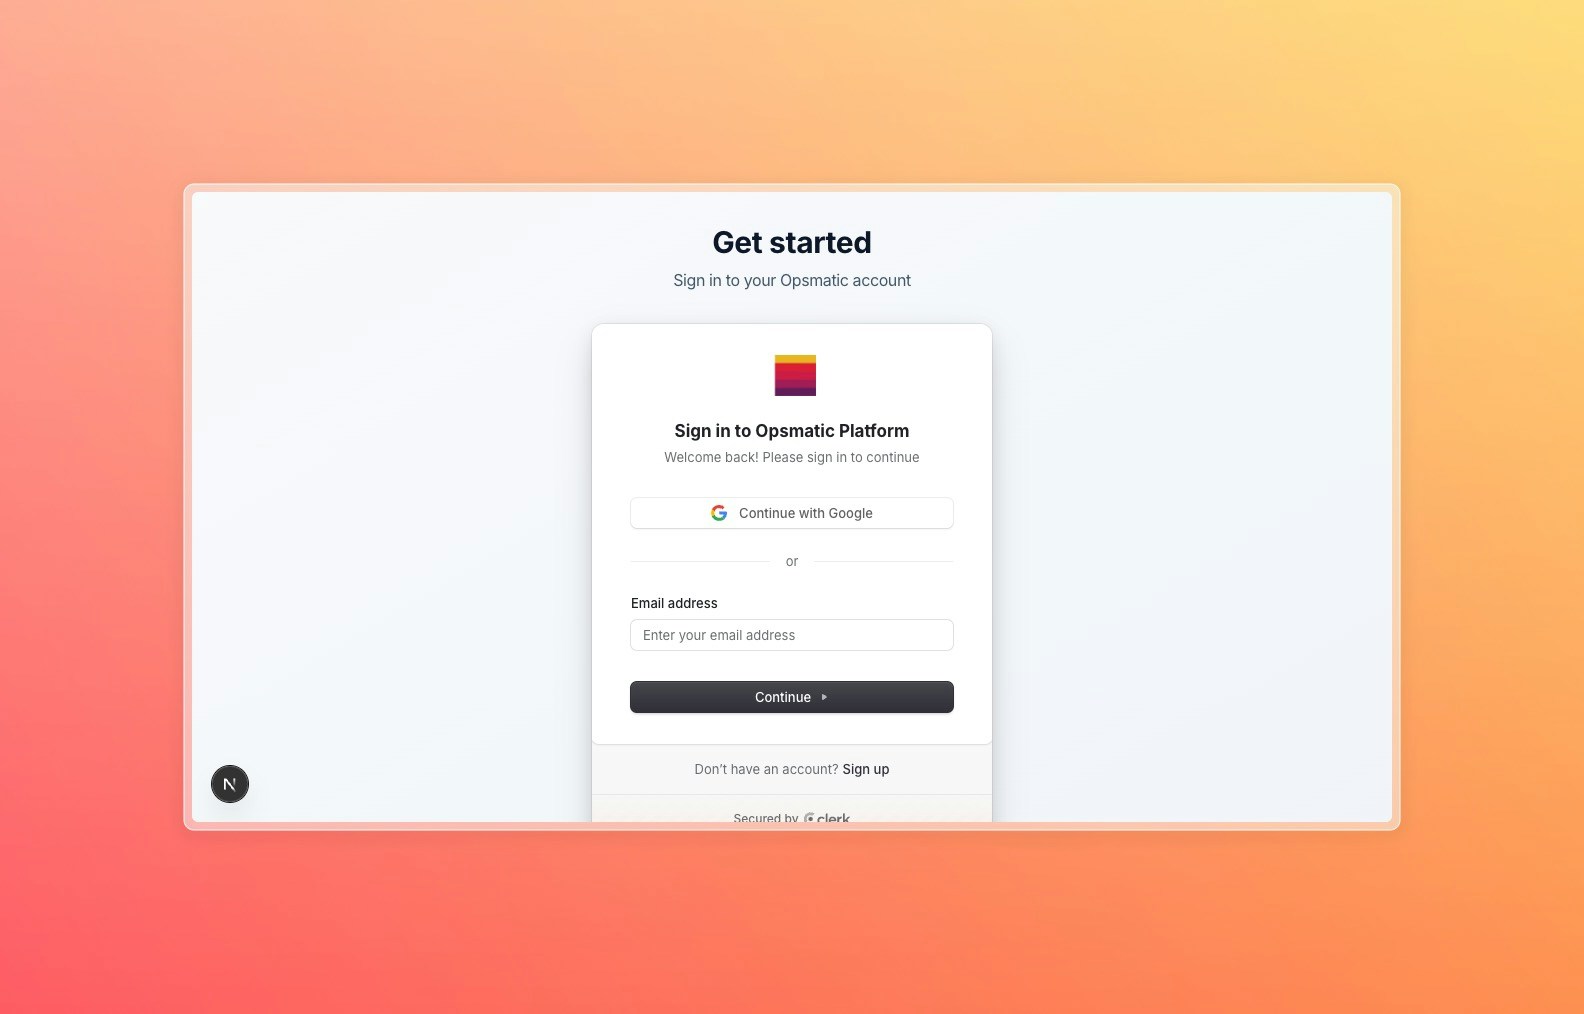
Welcome to Opsmatic! This guide will help you set up your account and start monitoring your first automation workflow.Step 1: Sign up for Opsmatic
- Visit https://opsmatic.com
- Click “Sign up” in the top right corner
- Choose your preferred sign-up method:
- Google - Sign in with your Google account
- GitHub - Sign in with your GitHub account
- Email - Create account with email and password
Step 2: Complete your profile
After signing up, you’ll be prompted to complete your profile:Connect your first platform
Option A: Connect n8n
If you’re using n8n, you’ll need your instance URL and API key:Enter Connection Details
- Service Name: Give your connection a descriptive name
- Base URL: Your n8n instance URL
- API Key: Your n8n API key
Option B: Connect Make.com
If you’re using Make.com, you’ll need your API token:Enter Connection Details
- Service Name: Give your connection a descriptive name
- API Token: Your Make.com API token
- Team ID: (Optional) If using Make.com teams
- Region: Select your Make.com region
Explore your dashboard
Once your connection is established, you’ll see your dashboard populate with data: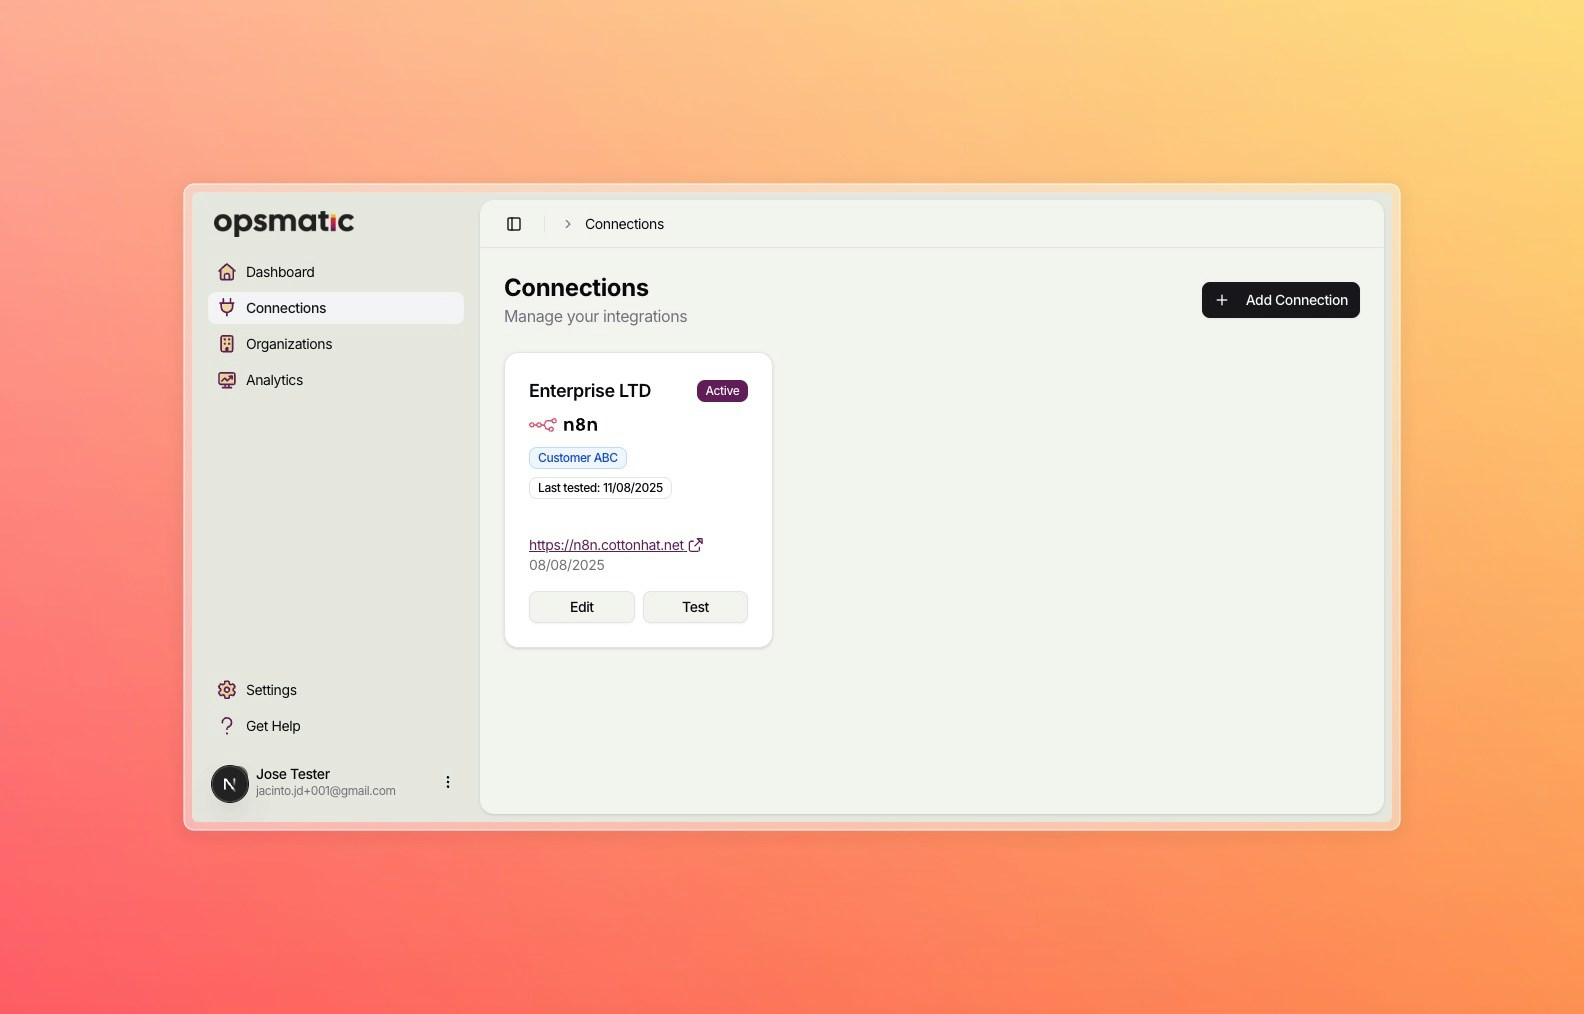
Key Dashboard Elements:
Connection Stats
Overview of your connected platforms, active workflows, and execution counts
Health Monitoring
Real-time status of your connections and platform availability
Recent Activity
Live feed of workflow executions, successes, and errors
Performance Metrics
Success rates, execution times, and performance trends
Enable Analytics Monitoring
To get the most out of Opsmatic, enable our comprehensive analytics monitoring:Configure Monitoring
For advanced monitoring, see our Analytics Setup Guide
What’s Next?
Set up Organizations
Invite team members and manage permissions
Configure Analytics
Set up detailed workflow monitoring and reporting
API Integration
Integrate Opsmatic with your existing tools
Billing Setup
Choose a plan that fits your monitoring needs
Need Help?
If you run into any issues during setup:- Check our troubleshooting guide
- Review connection problems
- Contact our support team
Pro Tip: Start with a single connection to familiarize yourself with the dashboard, then add additional platforms and team members as needed.