> ## Documentation Index
> Fetch the complete documentation index at: https://docs.opsmatic.io/llms.txt
> Use this file to discover all available pages before exploring further.
# Quickstart
> Get started with Opsmatic in under 5 minutes
## Setup your account
Welcome to Opsmatic! This guide will help you set up your account and start monitoring your first automation workflow.
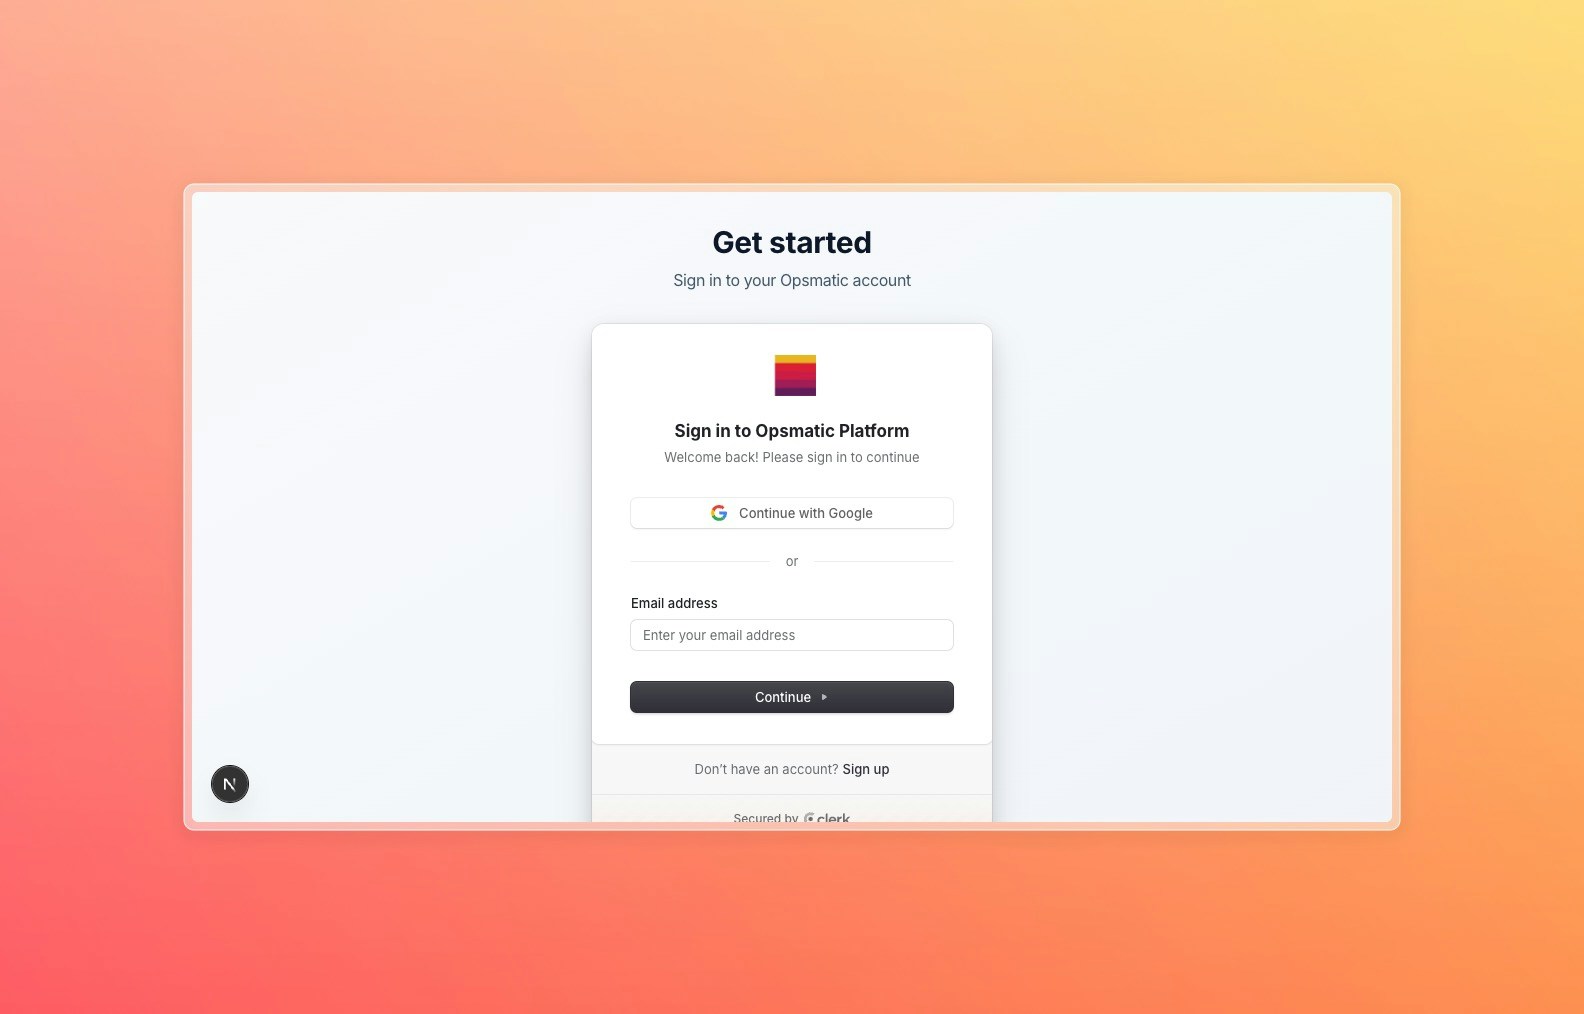
### Step 1: Sign up for Opsmatic
1. Visit [https://opsmatic.com](https://opsmatic.com)
2. Click **"Sign up"** in the top right corner
3. Choose your preferred sign-up method:
* **Google** - Sign in with your Google account
* **GitHub** - Sign in with your GitHub account
* **Email** - Create account with email and password
 ### Step 2: Complete your profile
After signing up, you'll be prompted to complete your profile:
Provide your name and confirm your email address
Tell us how you plan to use Opsmatic (personal, team, enterprise)
Select which automation platforms you use (n8n, Make.com, or both)
## Connect your first platform
### Option A: Connect n8n
If you're using n8n, you'll need your instance URL and API key:
```bash Self-hosted n8n theme={null}
# Your n8n instance URL
https://your-n8n-instance.com
# Generate API key in n8n Settings > API Keys
n8n_api_key_123...
```
```bash n8n Cloud theme={null}
# Your n8n cloud URL
https://your-subdomain.app.n8n.cloud
# Get API key from Account Settings > API Keys
n8n_cloud_api_key_456...
```
From your dashboard, click **"Add Your First Connection"**
Choose **n8n** from the platform options
* **Service Name**: Give your connection a descriptive name
* **Base URL**: Your n8n instance URL
* **API Key**: Your n8n API key
Click **"Test Connection"** to verify your credentials
Click **"Save Connection"** to complete the setup
### Option B: Connect Make.com
If you're using Make.com, you'll need your API token:
```bash Make.com API Token theme={null}
# Get your API token from Make.com
# Profile > API > Generate token
make_api_token_789...
```
```bash Team Setup (Optional) theme={null}
# If using Make.com teams, provide Team ID
Team ID: 12345
Region: eu2.make.com (default)
```
From your dashboard, click **"Add Your First Connection"**
Choose **Make** from the platform options
* **Service Name**: Give your connection a descriptive name
* **API Token**: Your Make.com API token
* **Team ID**: (Optional) If using Make.com teams
* **Region**: Select your Make.com region
Click **"Test Connection"** to verify your credentials
Click **"Save Connection"** to complete the setup
## Explore your dashboard
Once your connection is established, you'll see your dashboard populate with data:
### Step 2: Complete your profile
After signing up, you'll be prompted to complete your profile:
Provide your name and confirm your email address
Tell us how you plan to use Opsmatic (personal, team, enterprise)
Select which automation platforms you use (n8n, Make.com, or both)
## Connect your first platform
### Option A: Connect n8n
If you're using n8n, you'll need your instance URL and API key:
```bash Self-hosted n8n theme={null}
# Your n8n instance URL
https://your-n8n-instance.com
# Generate API key in n8n Settings > API Keys
n8n_api_key_123...
```
```bash n8n Cloud theme={null}
# Your n8n cloud URL
https://your-subdomain.app.n8n.cloud
# Get API key from Account Settings > API Keys
n8n_cloud_api_key_456...
```
From your dashboard, click **"Add Your First Connection"**
Choose **n8n** from the platform options
* **Service Name**: Give your connection a descriptive name
* **Base URL**: Your n8n instance URL
* **API Key**: Your n8n API key
Click **"Test Connection"** to verify your credentials
Click **"Save Connection"** to complete the setup
### Option B: Connect Make.com
If you're using Make.com, you'll need your API token:
```bash Make.com API Token theme={null}
# Get your API token from Make.com
# Profile > API > Generate token
make_api_token_789...
```
```bash Team Setup (Optional) theme={null}
# If using Make.com teams, provide Team ID
Team ID: 12345
Region: eu2.make.com (default)
```
From your dashboard, click **"Add Your First Connection"**
Choose **Make** from the platform options
* **Service Name**: Give your connection a descriptive name
* **API Token**: Your Make.com API token
* **Team ID**: (Optional) If using Make.com teams
* **Region**: Select your Make.com region
Click **"Test Connection"** to verify your credentials
Click **"Save Connection"** to complete the setup
## Explore your dashboard
Once your connection is established, you'll see your dashboard populate with data:
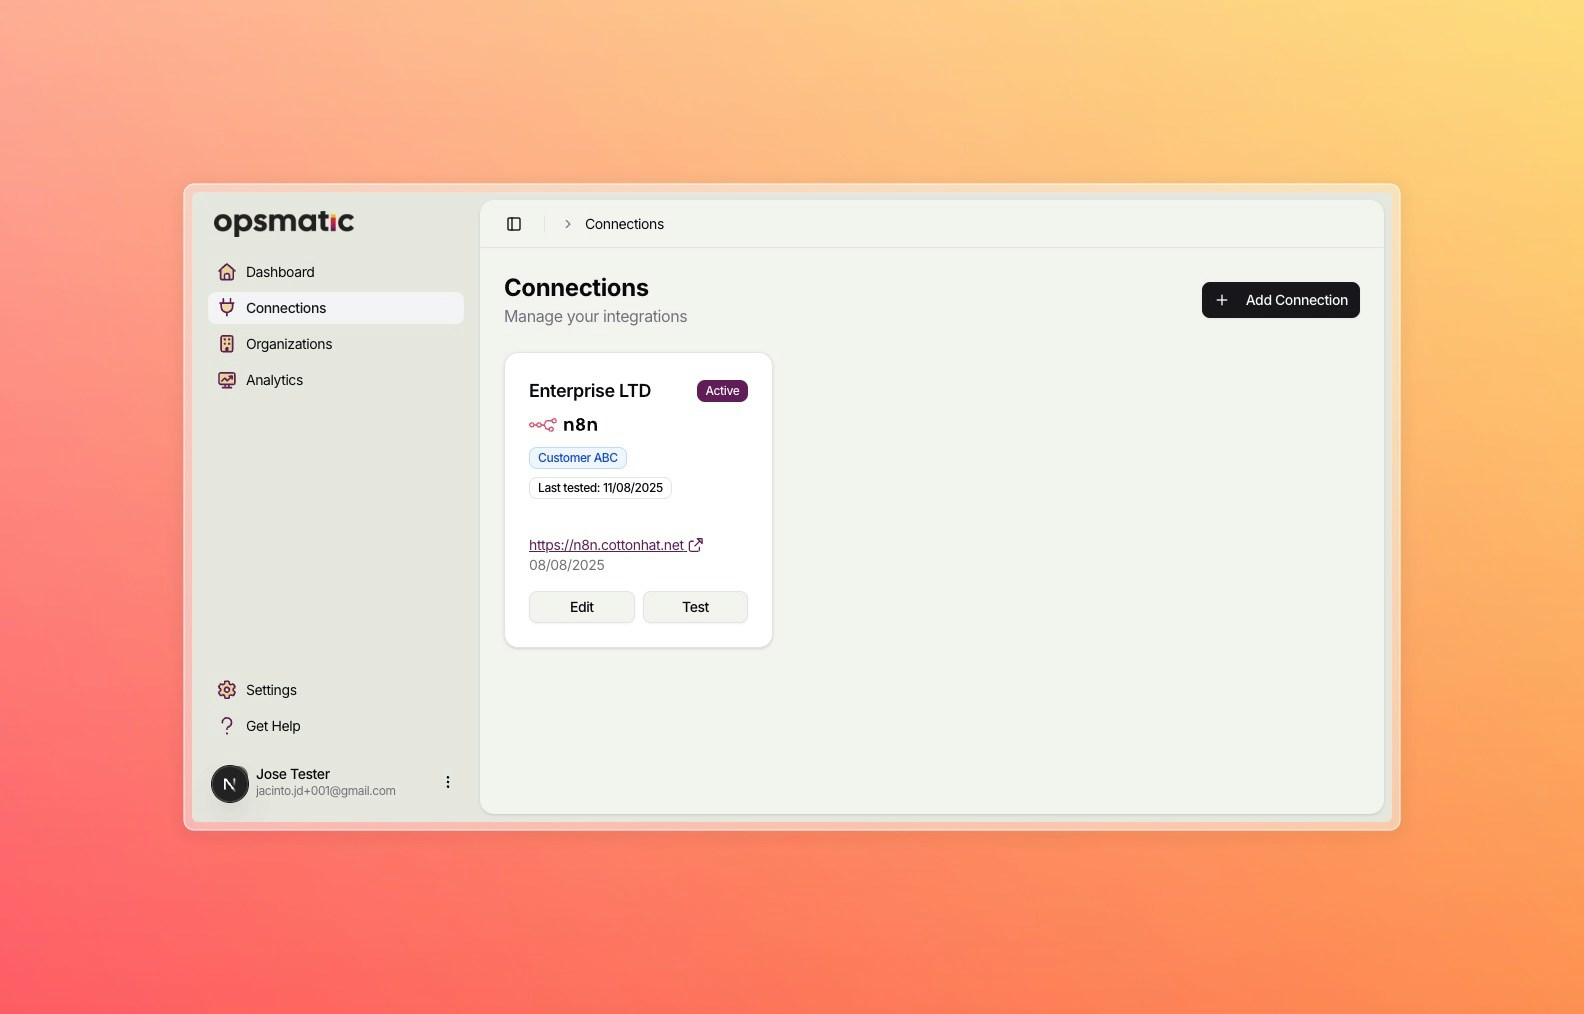 ### Key Dashboard Elements:
Overview of your connected platforms, active workflows, and execution counts
Real-time status of your connections and platform availability
Live feed of workflow executions, successes, and errors
Success rates, execution times, and performance trends
## Enable Analytics Monitoring
To get the most out of Opsmatic, enable our comprehensive analytics monitoring:
Analytics monitoring requires additional setup for detailed execution tracking. This is optional but recommended for full workflow insights.
Click **"Analytics"** in the sidebar navigation
You'll see execution logs, performance metrics, and availability data
For advanced monitoring, see our [Analytics Setup Guide](/analytics/overview)
## What's Next?
Invite team members and manage permissions
Set up detailed workflow monitoring and reporting
Integrate Opsmatic with your existing tools
Choose a plan that fits your monitoring needs
## Need Help?
If you run into any issues during setup:
* Check our [troubleshooting guide](/troubleshooting/common-issues)
* Review [connection problems](/troubleshooting/connection-problems)
* Contact our [support team](/troubleshooting/support)
**Pro Tip**: Start with a single connection to familiarize yourself with the dashboard, then add additional platforms and team members as needed.
### Key Dashboard Elements:
Overview of your connected platforms, active workflows, and execution counts
Real-time status of your connections and platform availability
Live feed of workflow executions, successes, and errors
Success rates, execution times, and performance trends
## Enable Analytics Monitoring
To get the most out of Opsmatic, enable our comprehensive analytics monitoring:
Analytics monitoring requires additional setup for detailed execution tracking. This is optional but recommended for full workflow insights.
Click **"Analytics"** in the sidebar navigation
You'll see execution logs, performance metrics, and availability data
For advanced monitoring, see our [Analytics Setup Guide](/analytics/overview)
## What's Next?
Invite team members and manage permissions
Set up detailed workflow monitoring and reporting
Integrate Opsmatic with your existing tools
Choose a plan that fits your monitoring needs
## Need Help?
If you run into any issues during setup:
* Check our [troubleshooting guide](/troubleshooting/common-issues)
* Review [connection problems](/troubleshooting/connection-problems)
* Contact our [support team](/troubleshooting/support)
**Pro Tip**: Start with a single connection to familiarize yourself with the dashboard, then add additional platforms and team members as needed.